Practical Analytic Approaches to Healthcare Challenges
Medicare Advantage plans have long recognized the importance of coding to ensure accurate risk scores and clinical documentation. By contrast, Accountable Care Organizations (ACOs) participating in the Medicare Shared Savings Program (MSSP) often focus less on the implications of risk adjustment or assume they have little ability to affect their risk scores. To understand why, there are two key aspects of the MSSP to consider:
- Regional adjustment: In the early years of the MSSP, benchmarks were purely based on the ACO’s historical experience. These benchmarks were not adjusted based on the absolute risk scores for the ACO beneficiaries, but rather the change in risk scores over time. Therefore, these ACOs were not penalized if their risk scores were understated by a similar amount in each year. This began to change in 2017 with the introduction of the regional benchmark adjustment, in which the benchmark is adjusted for the absolute difference between the ACO and the region average risk scores – making the ACOs’ absolute risk scores an important factor. However, before the Pathways to Success rule, this regional benchmark adjustment only applied to ACOs that started a second agreement period in 2017 or later.
- Demographic adjustment:Prior to the Pathways to Success rule, the MSSP limited the risk score changes for “continuously assigned” beneficiaries to be no more than a demographic adjustment. Because of the way continuously assigned beneficiaries were identified[1], this rule effectively made it impossible for ACO efforts to improve coding accuracy to significantly increase the ACO’s historical benchmark.
Given the considerations above, it is not surprising that ACOs have historically deemphasized coding accuracy. However, the landscape is now changing in ways that make risk scores even more important for two reasons:
- Under the Pathways to Success rule, the limitation on risk score changes for continuously assigned beneficiaries has been removed. Instead, there is now a limit of 3% in the total increase in risk score for the ACO from the historical benchmark to the performance year. This limit prevents ACOs from dramatically increasing their benchmark strictly due to risk score increases, but it should not deter ACOs from trying to ensure their risk scores are accurate and complete.
- Further, the year to year risk score adjustment can be greater than the 3% cap. For example, if the ACO’s underlying risk score decreases from baseline year 3 (BY3) to performance year 1 (PY1), then the risk score change from PY1 to PY2 could be greater than 3%.
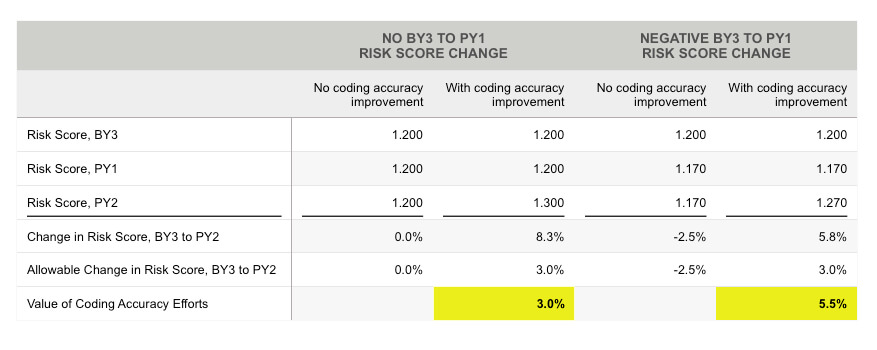
The figure below illustrates this possibility using a hypothetical ACO that improves coding accuracy from PY1 to PY2.
- In the “No BY3 to PY1 Risk Score Change” scenario, the ACO’s historical benchmark is limited to a 3.0% risk score change even though coding accuracy efforts led to an 8.3% risk score increase.
- In the “Negative BY3 to PY1 Risk Score Change” scenario, the ACO’s risk score would have decreased by 2.5% relative to BY3 if risk scores remained flat from PY1 to PY2, but the coding accuracy efforts actually led to a 5.8% risk score increase relative to BY3. Even though the change from BY3 to any PY is capped at 3.0%, the value of the coding accuracy efforts is 5.5% (3.0% minus -2.5%).

Effect of Risk Scores on Historical MSSP Results
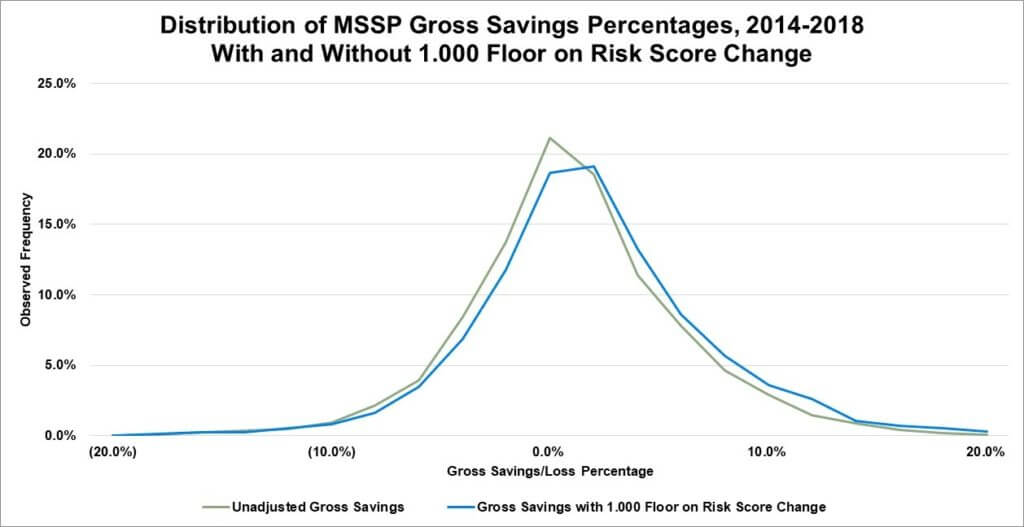
Even before the implementation of the Pathways to Success rule, coding accuracy efforts could limit risk score decreases for the continuously assigned population. Based on a review of the 2014 through 2018 MSSP Public Use Files (PUFs), we found that approximately 49% of ACOs had an aggregate risk score change from Benchmark Year 3 (BY3) to Performance Year (PY) of less than 1.000. Although the PUFs do not split out the continuously assigned and newly assigned risk scores, it is likely that many of these ACOs had a decrease in their continuously assigned risk scores, which means these ACOs could have benefitted from coding accuracy efforts to mitigate this decrease. If these ACOs had all been able to maintain an aggregate risk score change of 1.000, the average gross savings across all ACOs from 2014-2018 would have increased from approximately 1.1% to 1.9%.[2] The graph below shows the distribution of gross savings before and after applying a 1.000 floor to the risk score change.

The impact on shared savings depends on the specific situation of each ACO, such as their minimum savings rate, Track selection, and quality performance. However, for example, if we applied the sharing parameters of the ENHANCED Track and a 2.0% minimum savings rate/minimum loss rate (MSR/MLR) to each ACO, this would have resulted in an average increase in average net shared savings/(losses) of $51 per beneficiary per year (PBPY). For a 20,000-life ACO, this would equate to approximately $1 million.
Regional Benchmark Adjustment
The benchmark for most ACOs in their second or later agreement period, and ACOs starting under the Pathways to Success rule, is adjusted based on the ACO’s risk-adjusted expenditures relative to all Medicare FFS beneficiaries in the ACO’s region. The regional benchmark adjustment is based on each ACO’s risk scores for their last benchmark year. Therefore, the risk scores in an ACO’s last benchmark year are particularly important. For an ACO starting an agreement period under Pathways to Success in CY 2020, the risk-adjusted regional expenditures for their next agreement period will be based on risk scores in CY 2024, which use diagnosis codes from CY 2023. While not immediately relevant for active ACOs, this will have a significant impact on the benchmark for the next agreement period.
Conclusion
No matter their specific situation, ACOs should ensure their assigned beneficiaries have accurately coded risk scores that reflect their full morbidity level. As a result of changes to MSSP rules over the past few years, particularly the Pathways to Success rule, risk adjustment is becoming increasingly relevant to financial results for ACOs participating in the MSSP, and neglecting the importance of accurate risk score coding accuracy is a risk that is not worth taking.
References:
Shared Savings Program Accountable Care Organizations (ACO) Public Use Files. Centers for Medicare & Medicaid Services.
[1] Any beneficiary who was either assigned to the ACO or received a primary care service from any of the ACO participants in the previous year was considered “continuously assigned.” [2] Due to the limitations of the PUFs, this analysis does not precisely capture the impact of risk score decreases on each ACO’s benchmark, but approximates the overall impact across all ACOs. Some ACOs with a risk score decrease may still have been subject to the demographic adjustment on the continuously assigned population, meaning they may not have benefited from a higher performance year risk score. However, it is also possible that some ACOs with a risk score increase may have had a decrease in risk score for the continuously assigned population, and therefore they could have benefited from a higher performance year risk score.Thank you to Grant Churchill for his contributions to the analyses in this post.