Childbirth is the leading cause of hospital admissions in the United States, with cesarean deliveries being the most frequently performed surgical procedure.1 Cesarean deliveries are a crucial and life-saving intervention2 but they can also pose increased risks to both mothers and infants, including infections, respiratory complications, and challenges in future pregnancies.3,4,5 The number of cesarean deliveries has risen, and multiple studies have identified factors linked to higher cesarean rates, notably advanced maternal age and insurance type, which reveal disparities in cesarean delivery6 occurrences across different groups.7,8
In 2010, a World Health Organization (WHO) expert panel estimated that one-third of the 18.5 million cesarean deliveries performed annually were “unnecessary” and done without medical indication.9 Current research shows that the global cesarean delivery rate is approximately 21%, and it is projected to rise to 28.5% by 2030, with about 38 million cesarean deliveries performed worldwide.10,11
In 2024, the National Vital Statistics Report indicates that the overall cesarean rate in the U.S. was 32.4%. Among low-risk births, defined as nulliparous women (never having given birth to a live baby before) delivering a singleton (one fetus), cephalic (head-first) birth at 37 or more weeks gestation, the cesarean rate was lower, at 26.6%.12 Despite this distinction, cesarean delivery rates remain substantial and contribute to increased healthcare utilization and costs, especially for hospitals. For instance, a 2020 Health Care Cost Institute report analyzing 2016-17 employer-sponsored insurance data in the US found that the average cost for a vaginal birth was $12,235, whereas for a cesarean1 it was $17,004.13
Our analysis aimed to understand how different variables influence cesarean rates within a precisely defined population as established by the evidence-based PC-02 Cesarean Birth measure13. To do so, we conducted a retrospective cohort study of nulliparous females aged 8 to 64, without complications, who delivered term, singleton infants in the vertex position. Our primary objectives were to examine trends in cesarean rates by maternal age and insurance status, evaluate post-cesarean complications, and assess related cost implications, ultimately identifying high-risk groups for targeted payer interventions.
Study population and delivery trends
We used over 80 million lives from the MedInsight Emerging Experience database from 2021 to 2024, with the following distribution across payer types: 81% Commercial, 13% Medicaid, and 6% Medicare. In total, the retrospective cohort study identified 1,895,052 deliveries, from which 8,137 members met the criteria for inclusion as nulliparous women with a singleton delivery. Among these, 75% were covered under Commercial plans, 24.6% under Medicaid, and 0.3% under other product lines. Based on the specifications for PC-02 Cesarean Birth measure, we excluded women with maternal or obstetrical complications that required cesarean section delivery. Approximately 13% of the total nulliparous women were excluded due to factors such as early labor, 35-36 weeks of pregnancy, oblique or breech presentation (bottom or feet-first position of the baby), placenta previa (low-lying placenta), and multiple births. Figure 1 shows the year-wise proportion of nulliparous women with singleton deliveries from 2021 to 2024, divided into three groups:
- Women with complications (proportion slightly increasing from 12.1% in 2023 to 14.3% in 2024)
- Women with gestational age less than 37 weeks or unable to determine (ranging between 3.1% and 4.4%)
- Nulliparous women without complications (the largest group, but slightly decreasing from 87.9% in 2023 to 85.7% in 2024)
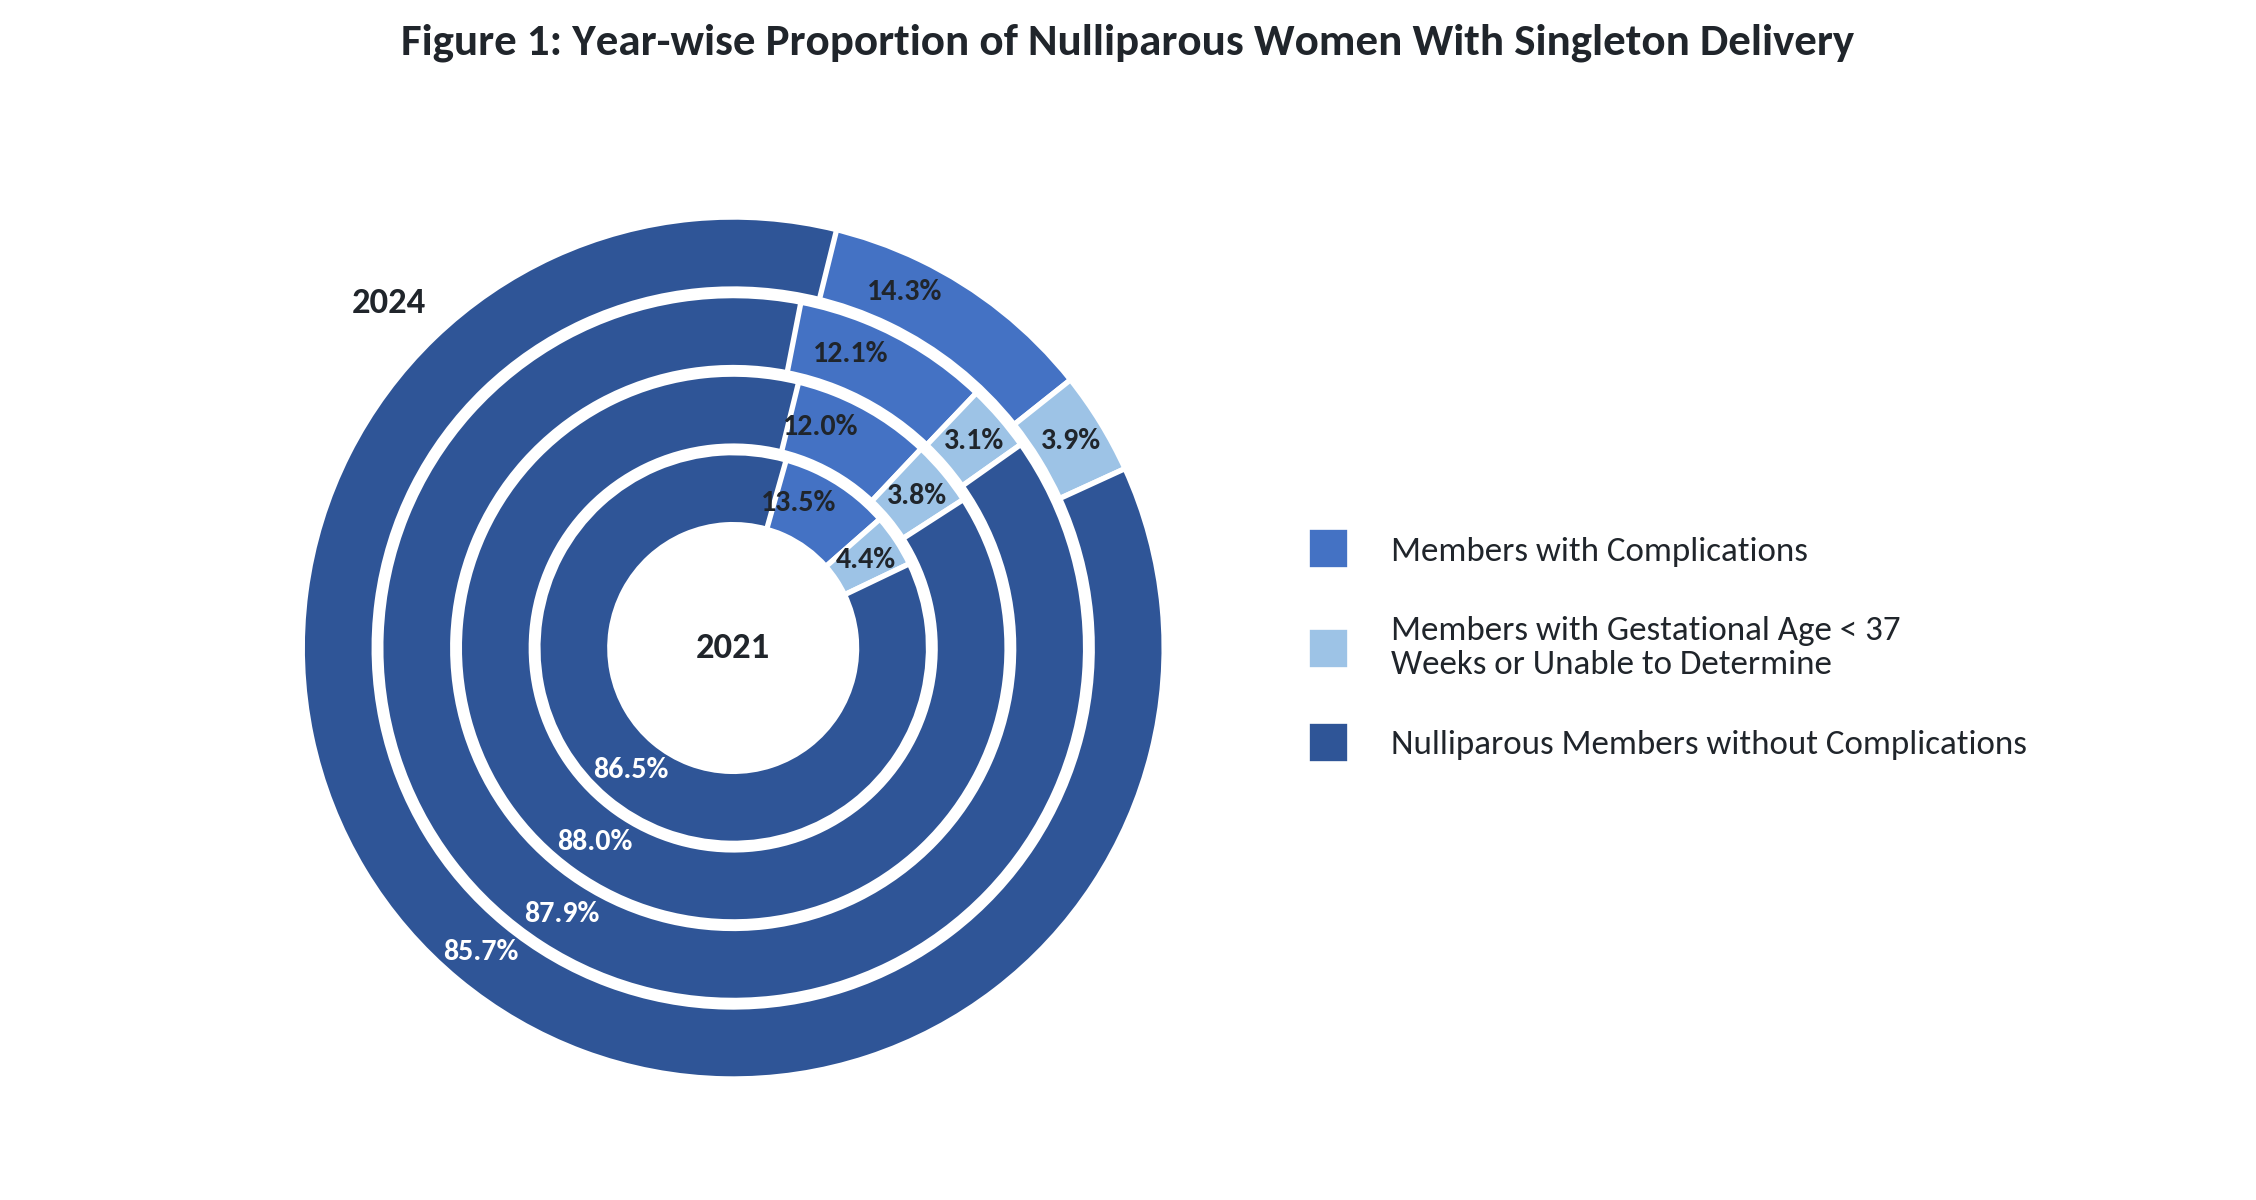
The data suggest that the majority of nulliparous women with singleton deliveries consistently represent a low-risk group after excluding cases of multiple gestations and early or undetermined gestational age. While the proportions of women with multiple gestations and those with gestational age under 37 weeks or unknown show some fluctuation, the overall composition remains relatively stable over the four years.
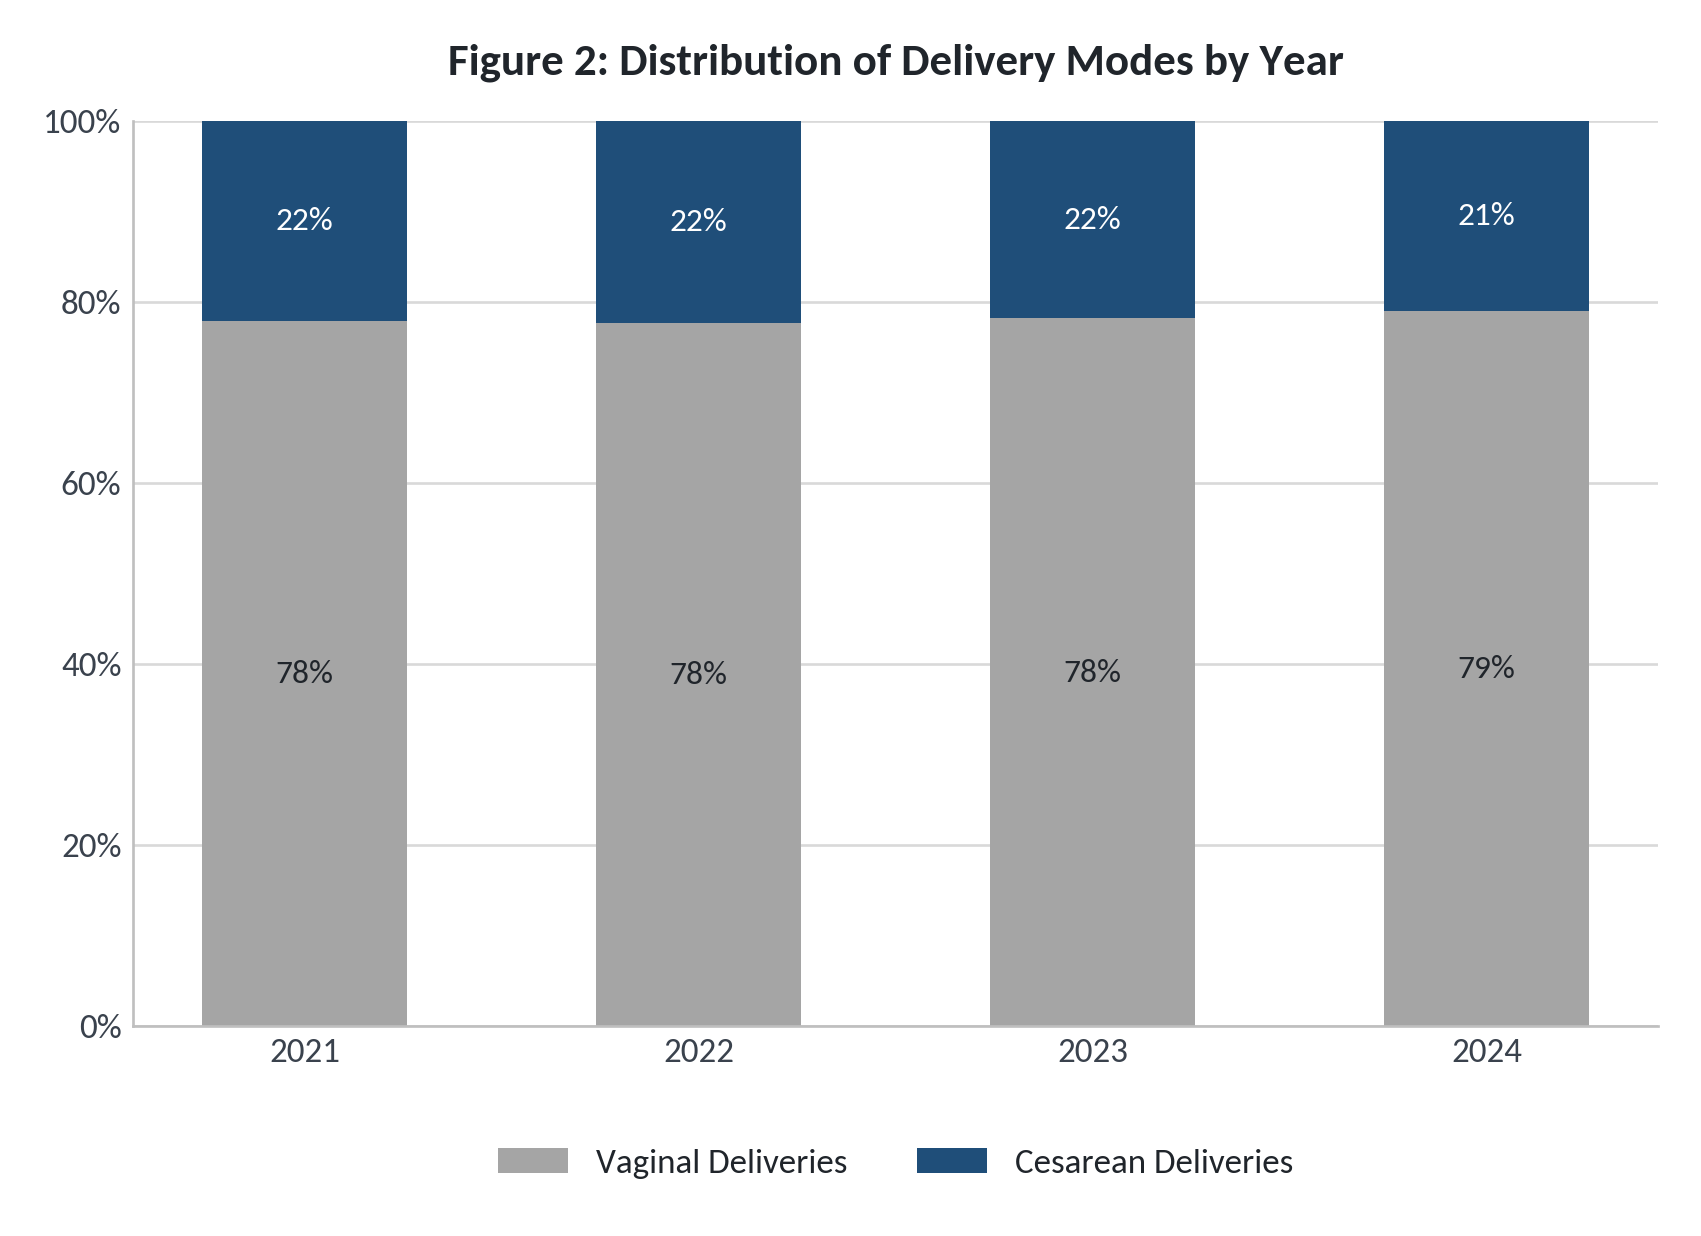
Figure 2 presents a yearly comparison of cesarean and vaginal deliveries from 2021 to 2024. The data indicated that vaginal deliveries consistently outpaced cesarean deliveries throughout the period, underscoring the ongoing predominance or preference for vaginal delivery in the studied population over these four years.
Maternal age and payer mix
In our study population, the percentage of women undergoing childbirth demonstrated an upward trend with increasing maternal age, with the lowest rate observed in women under 18 years (3.6%), rising to 31.9% in the 18 to 25 years group, then increasing significantly to 46.8% in the 26 to 35 years group, and showing a decline (17.6%) among women aged 36 years and above.
The CDC 2022 report suggests that women over 40 years are more likely to undergo cesarean deliveries compared to those under 206. In our analysis of delivery modes across maternal age groups, vaginal deliveries were more prevalent than cesarean sections in all age groups. However, the proportion of cesarean deliveries increased with advancing maternal age, with the highest rate observed among women aged 36 years and above. This trend indicates a positive association between maternal age and the likelihood of cesarean delivery (figure 3).
*Maternal age is calculated based on the date of discharge
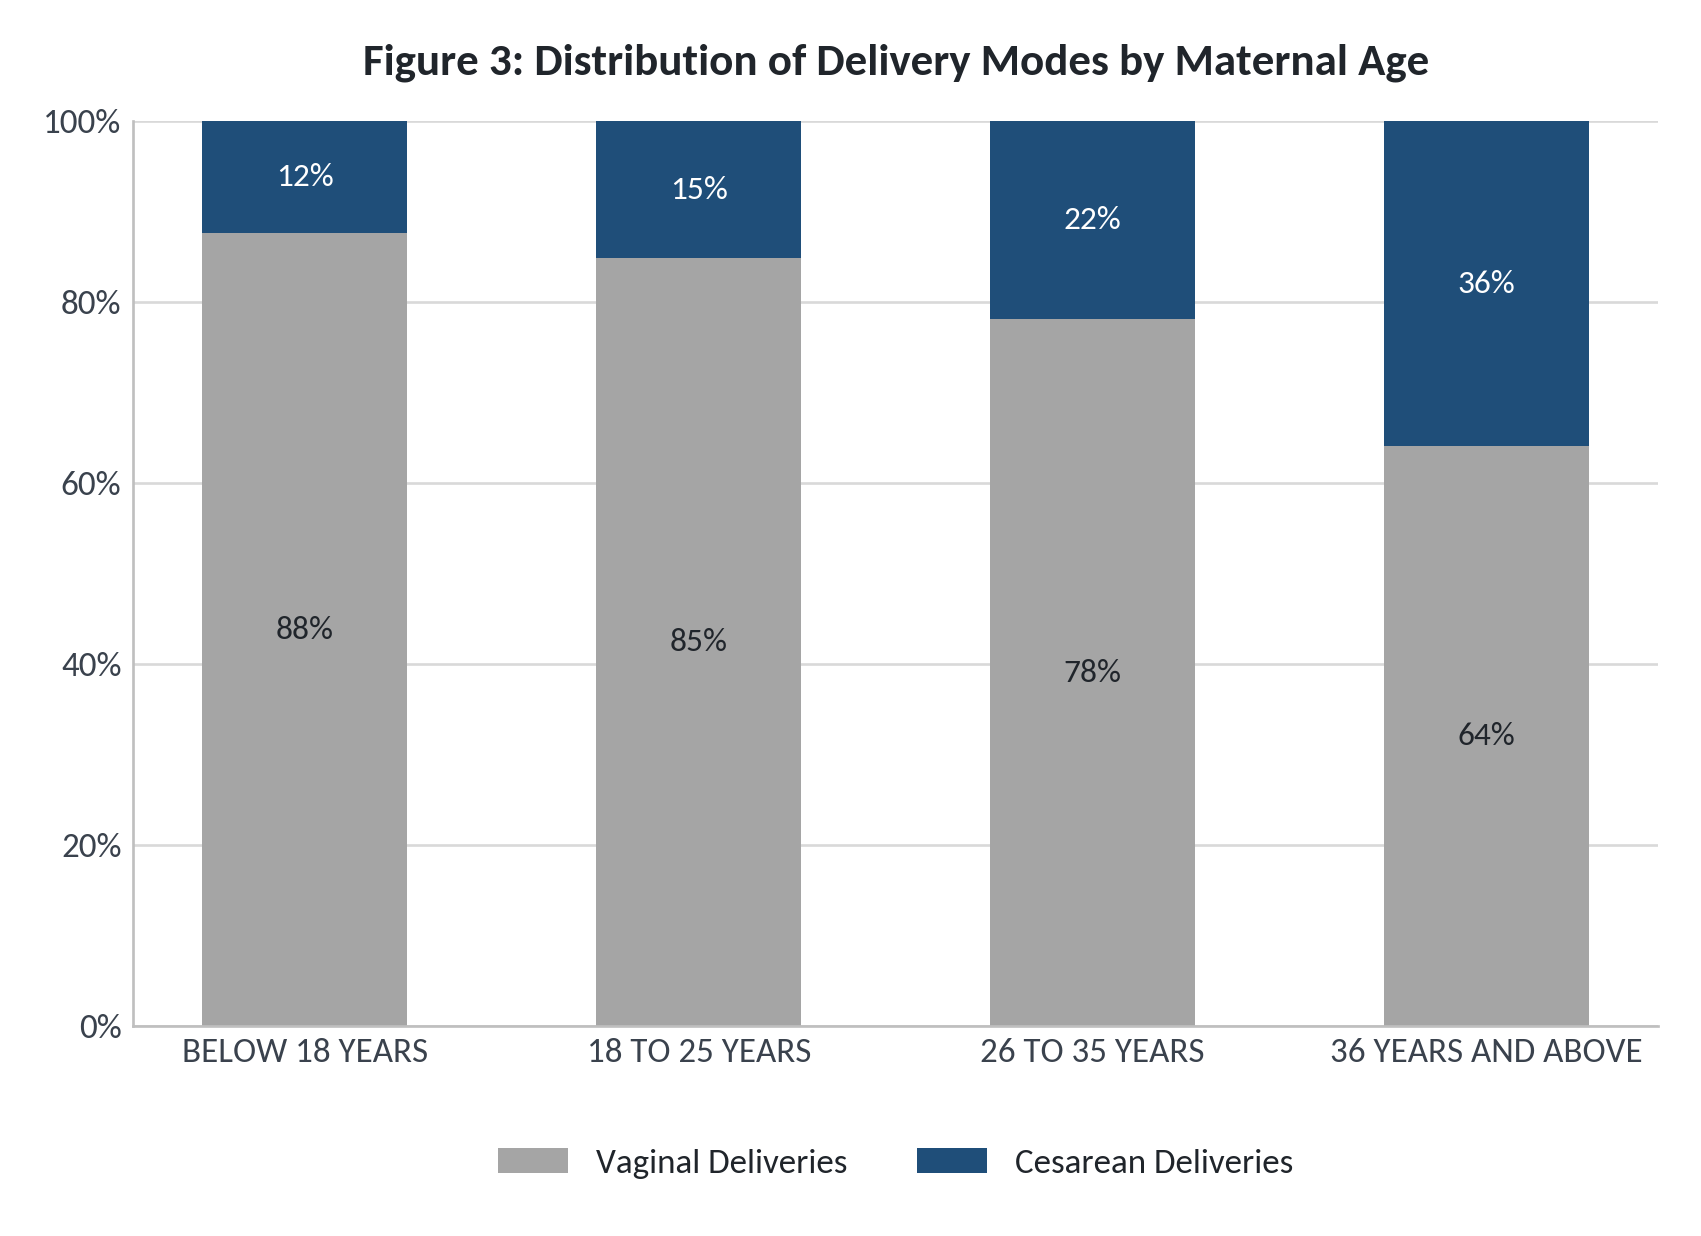
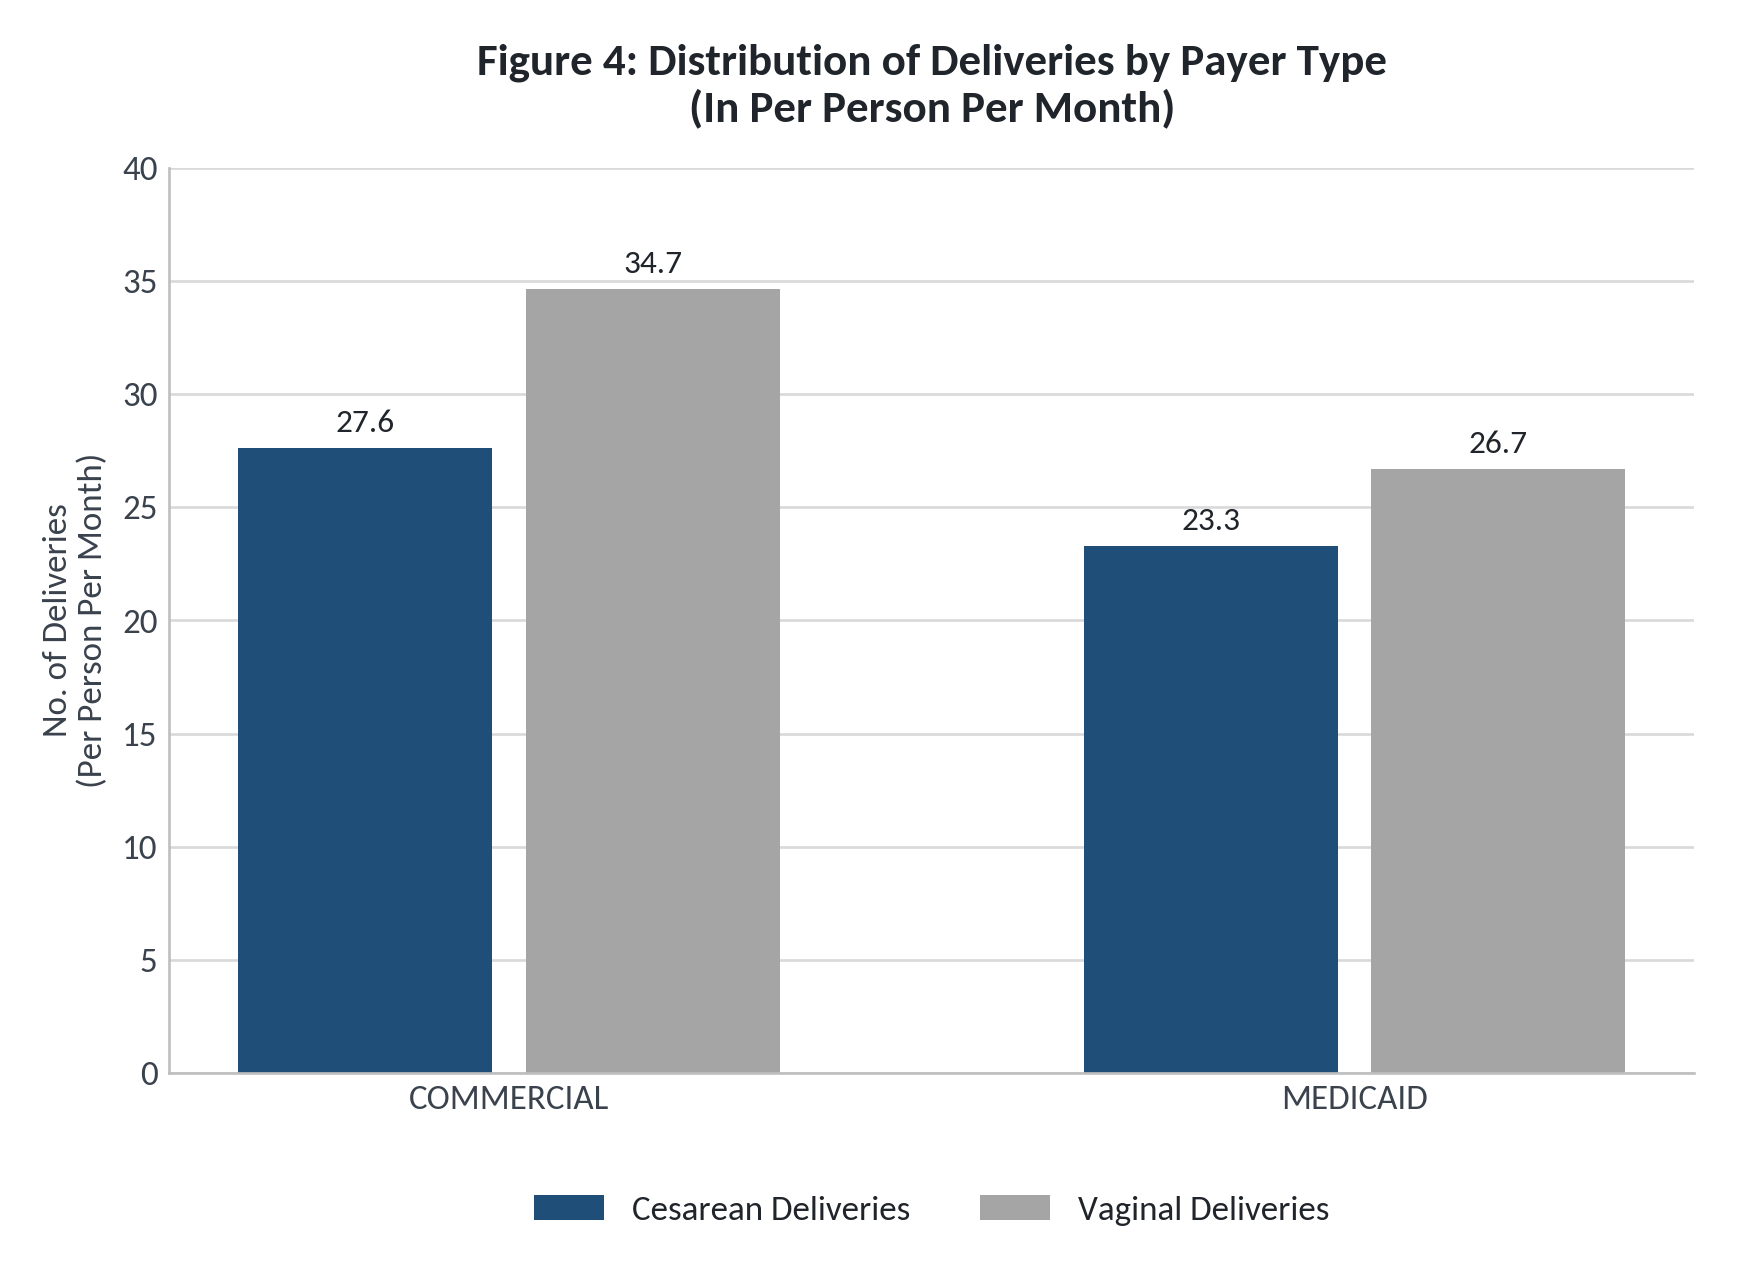
Figure 4 presents the distribution of deliveries by payer type in the study population, highlighting the proportion of cesarean versus normal vaginal deliveries (calculated using the Per Person Per Month metric). Notably, vaginal deliveries were more common in both payer groups. However, when considering cesarean delivery rates, the Commercial population showed higher proportions compared to the Medicaid payer type. Because the number of members enrolled in other product lines in the study was small, the analysis was limited to only the Commercial and Medicaid payer types.
Costs and complications
The study also found that cesarean deliveries were 1.6 times more expensive than normal vaginal delivery, excluding the expenses incurred for post-surgical complications. Additionally, women who underwent cesarean delivery had a longer average hospital stay of 3.5 days, compared to 2.4 days for vaginal deliveries, contributing to increased cost and greater resource utilization associated with cesarean procedures.
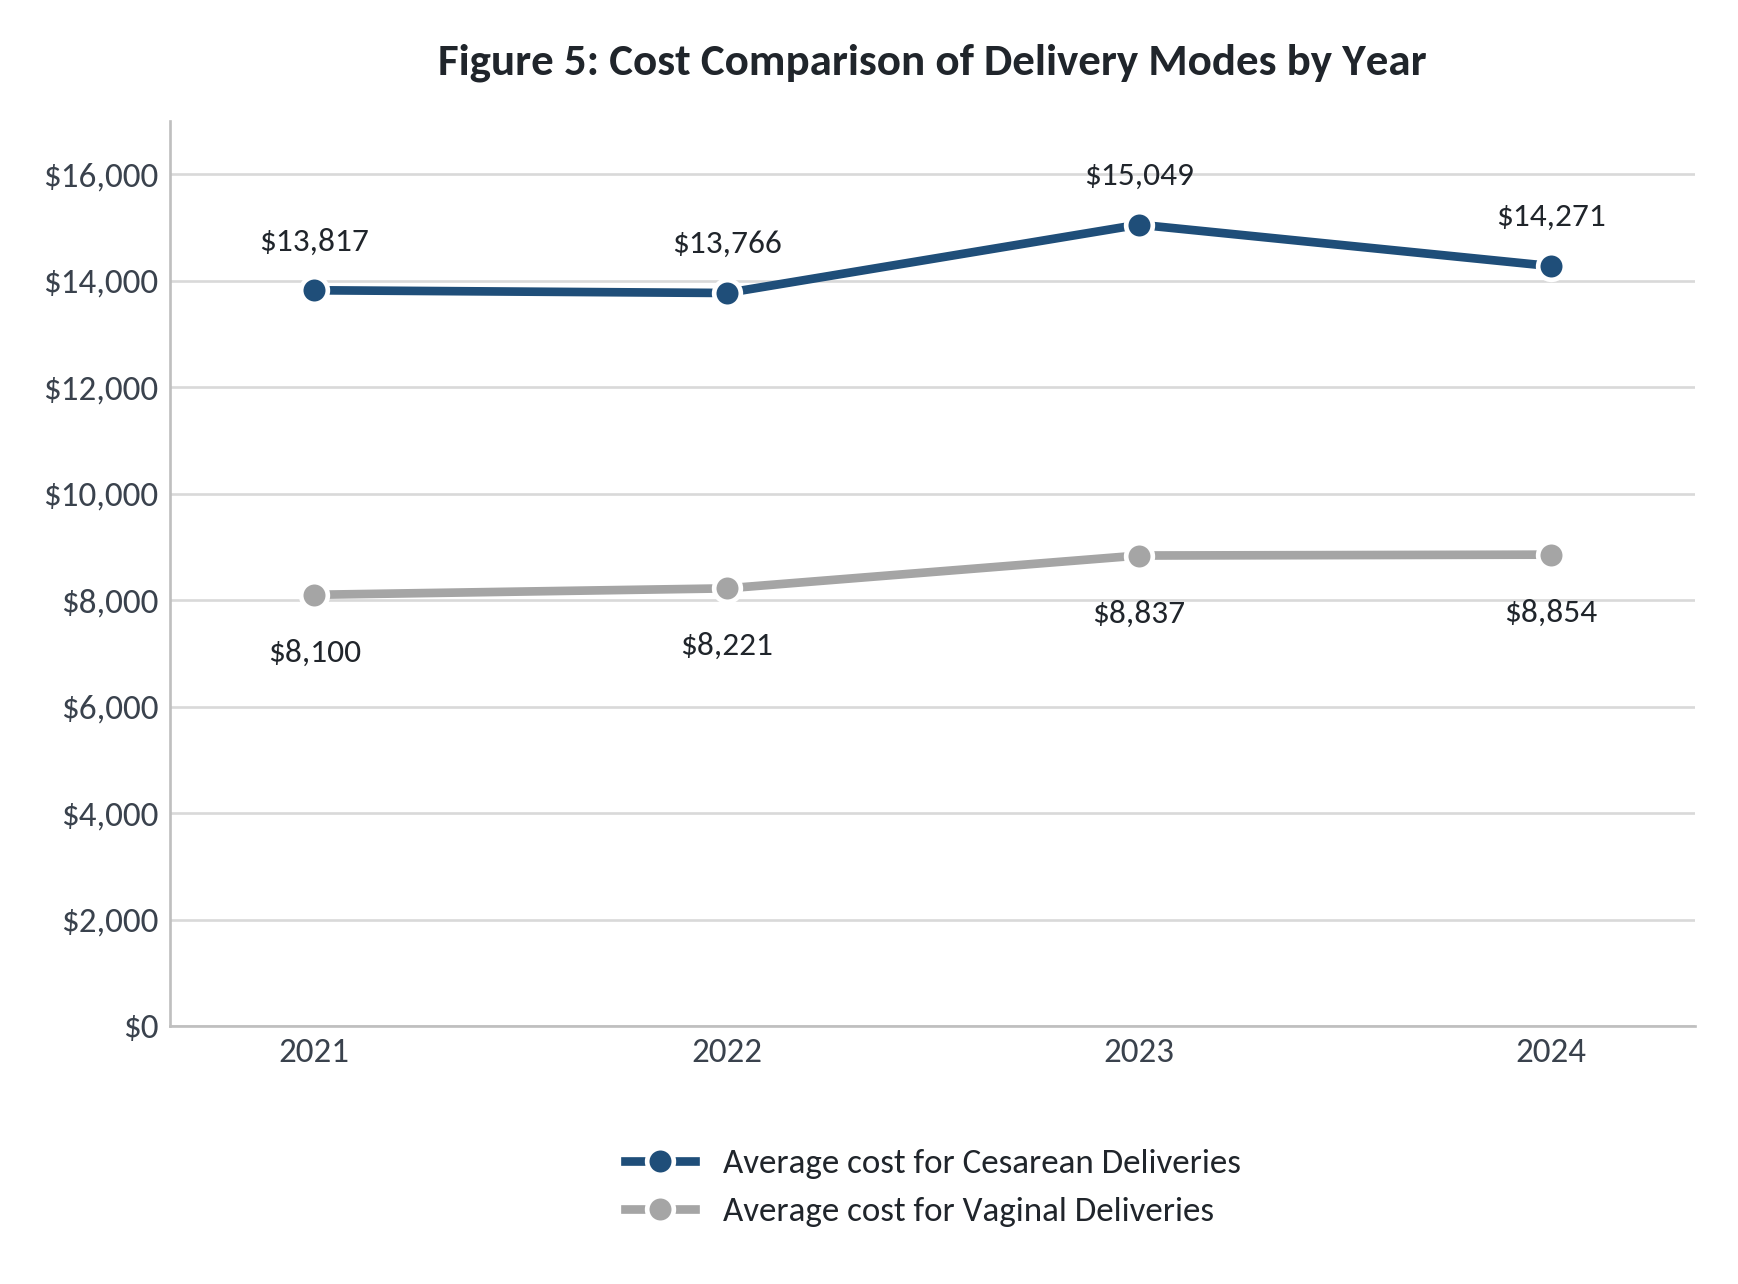
From 2021 to 2024, cesarean deliveries consistently remained more expensive than vaginal births, with average costs ranging from $13,000 to $14,500. In contrast, vaginal delivery costs averaged approximately $8,000 in 2021 and showed a steady increase, peaking in 2024. (see Figure 5).
A notable rise in cesarean delivery costs in 2023 coincided with payer mix shifts, where commercial insurance covered 84% of deliveries, an increase of 10% from the previous year, exhibiting higher reimbursements and increased cesarean costs. By 2024, 3% rise in Medicaid proportions and a decline in commercial moderated costs highlight the payer mix’s direct revenue impact.
We further analyzed the post-partum visits to identify early complications occurring within 42 days after delivery in both groups. Among those who had cesarean deliveries, 3.6% experienced postpartum complications, compared to 1.7% of women with vaginal deliveries. The most common complications included disruption of the cesarean wound, pyrexia, and hematoma of the obstetric wound, which together resulted in an average additional cost of $3,737.20 per delivery. Figure 6 presents the proportion of women with complications together with the associated costs for each complication type.
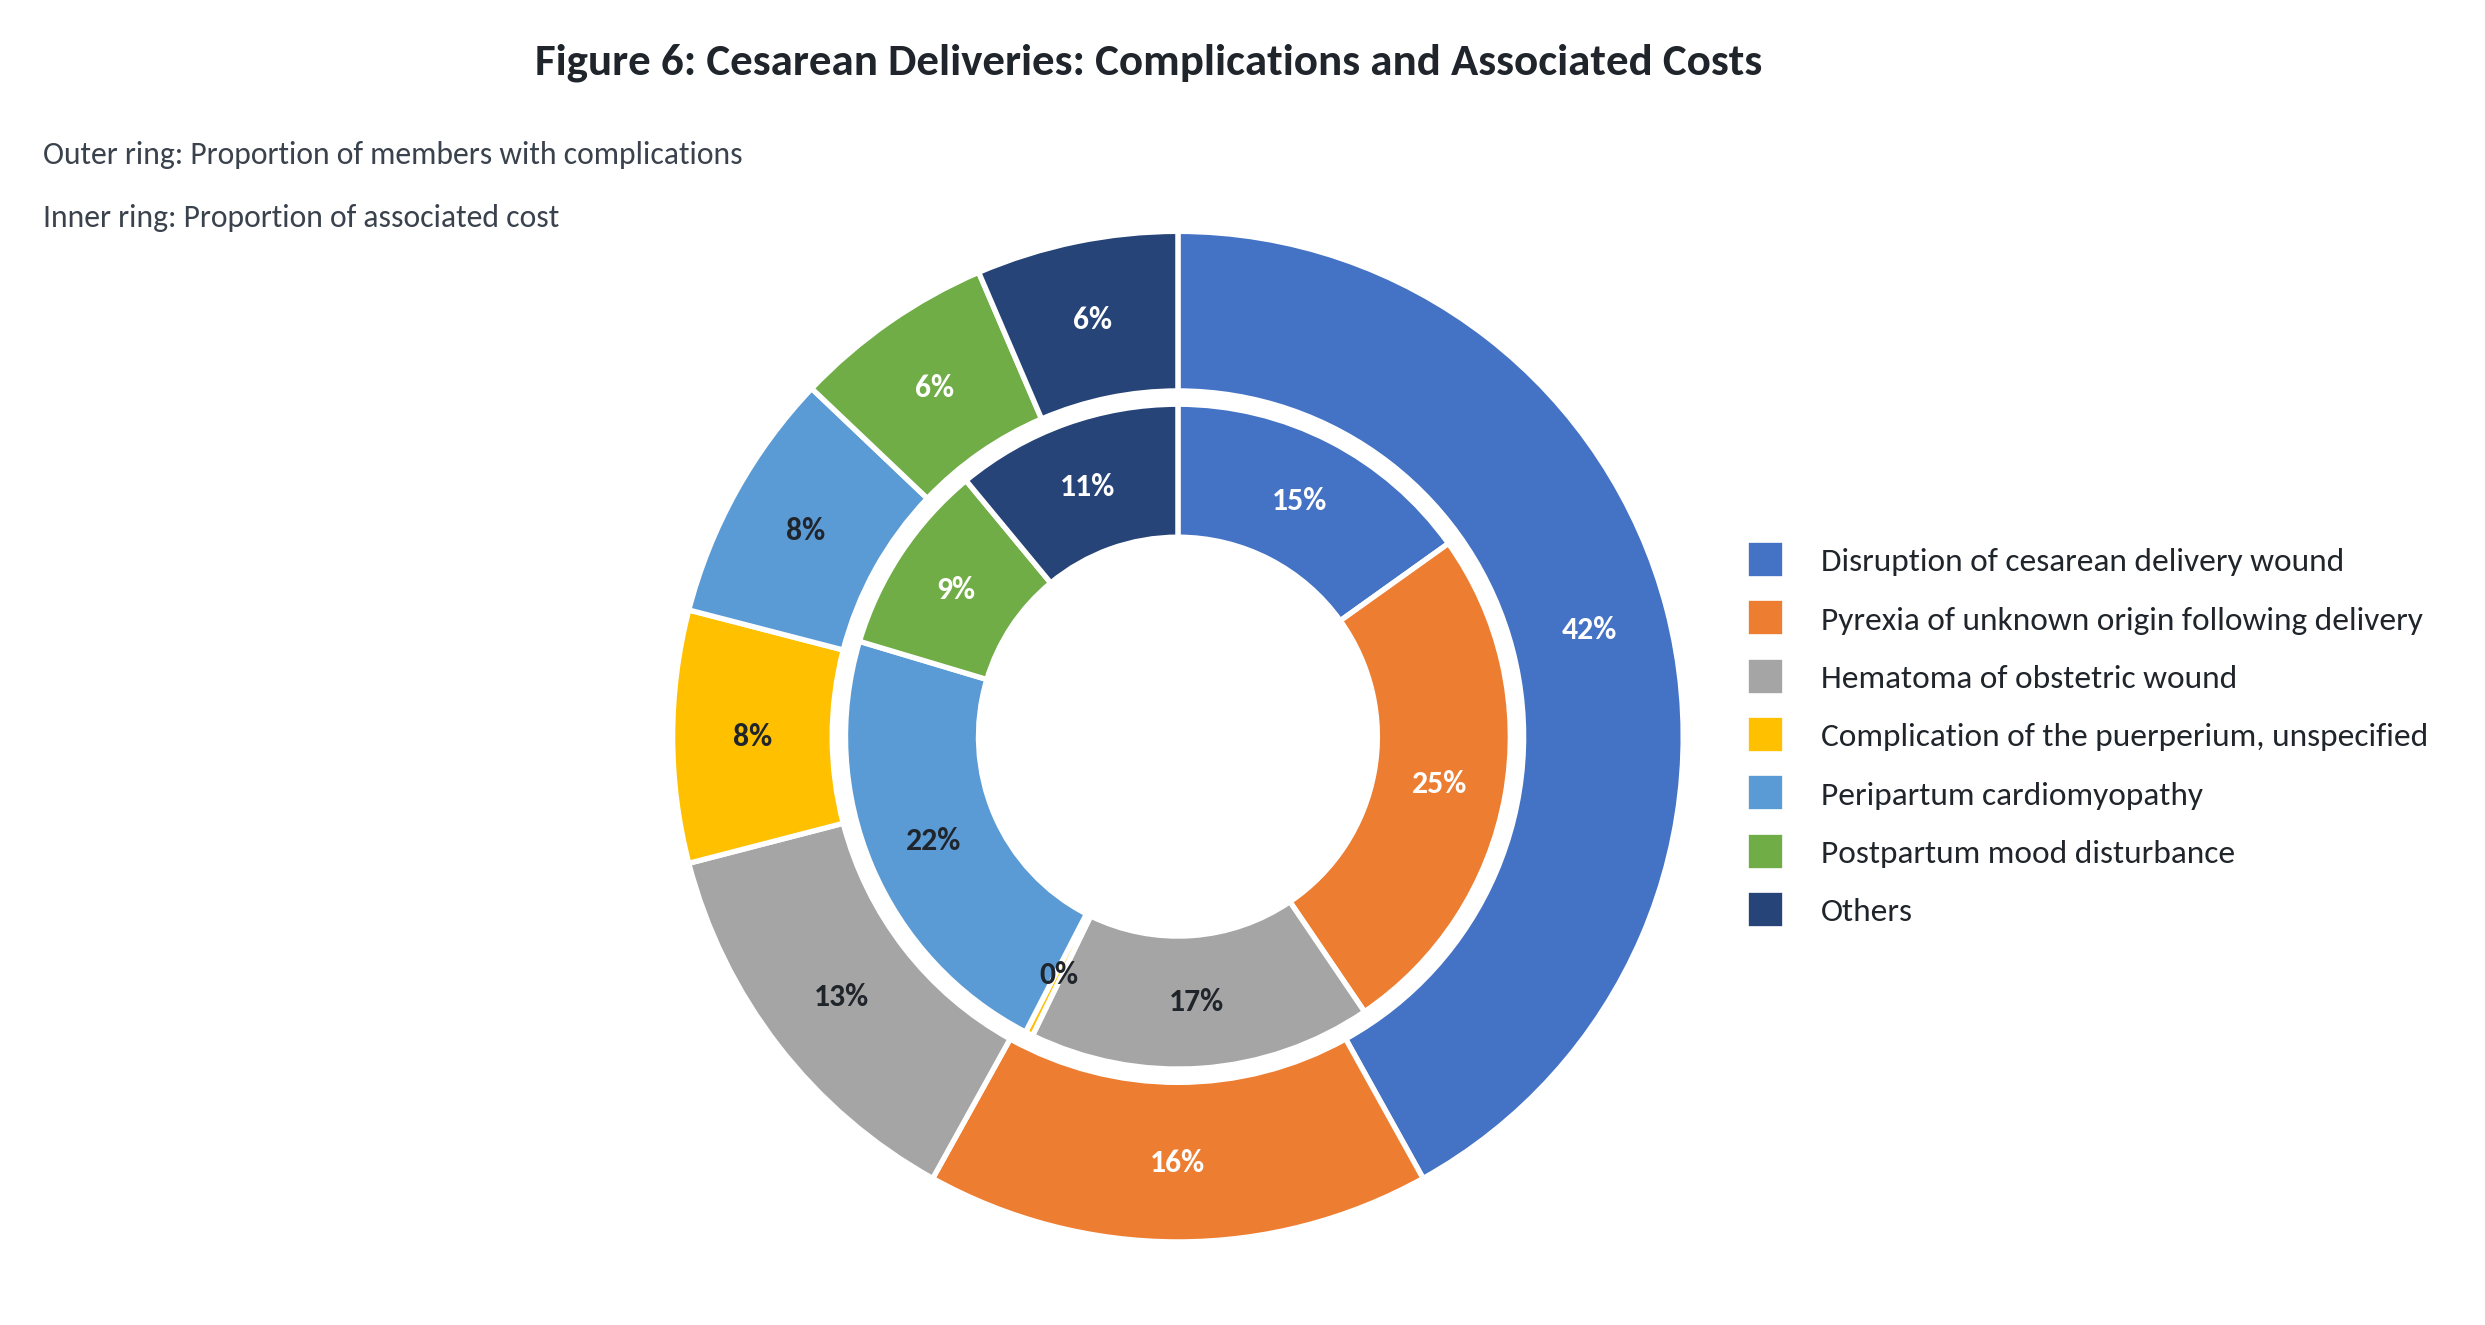
The analysis of post-cesarean section complications showed that frequency does not always correlate with treatment cost. Disruption of the cesarean delivery wound is the most common complication (42% of cases), but accounts for only 15% of total costs. In contrast, less frequent complications, such as pyrexia of unknown origin (16% of cases, 25% of costs) and peripartum cardiomyopathy (8% of cases, 22% of costs) represent a disproportionately high share of expenses. Notably, unspecified puerperium complications affect 8% of members but contribute negligibly to overall cost.
These findings highlight that rare but severe complications drive a significant portion of post-cesarean treatment costs, underscoring the need for targeted management strategies to improve outcomes and optimize resource allocation.
Conclusion
Overall, the study highlights that cesarean deliveries are associated with higher costs, longer hospital stays, and an increased risk of early postpartum complications compared to vaginal deliveries. These complications can affect patient outcomes and contribute significantly to additional healthcare expenses. Efforts to optimize delivery methods and enhance postpartum care could help reduce the clinical and economic burden of cesarean sections.
Our study found a positive association between maternal age and the likelihood of cesarean delivery (Figure 3), even among women without medical complications. To reduce potentially avoidable cesarean deliveries in this group, it is important to provide comprehensive prenatal education and encourage informed decision-making. By ensuring older expectant mothers receive clear information and have open discussions with healthcare providers, decisions can be based on individual health needs rather than age. These patient-centered approaches may help lower cesarean rates and promote safer, more appropriate childbirth experiences.
On the provider side, strict adherence to evidence-based clinical guidelines is crucial to ensure the procedure’s necessity. Regular audits and feedback on individual and hospital-level cesarean rates can encourage responsible decision-making.
At the system and public health levels, targeted interventions can further curb potentially avoidable primary cesarean sections for low-risk deliveries. Payment reforms, such as bundled maternity care payments, can remove financial incentives favoring cesarean delivery, promoting safer, guideline-based practices. Expanding access to and support for vaginal birth after cesarean (VBAC) is another effective approach. Participation in quality improvement initiatives, like the WHO safe childbirth checklist, might help enhance delivery outcomes. Public awareness campaigns and regulations to monitor cesarean section rates can also promote informed choices and accountability, thereby improving maternal and neonatal safety. Raising awareness and implementing targeted interventions can pave the way for safer, more cost-effective childbirth experiences for all families.
Lastly, integrating evidence-based practices with clinical quality measures, such as those provided by MedInsight Evidence-Based Measures (EBM), can significantly enhance these efforts. MedInsight’s robust quality metrics help identify target populations, inform intervention design, and optimize resource allocation. These data-driven tools allow healthcare providers and policymakers to monitor outcomes, track progress, and implement interventions that improve population health. Furthermore, broader initiatives addressing overall clinical activity hold great potential to drive meaningful improvements in patient care.
References
- Johnson W, Milewski A, Martin K, Clayton E. Understanding Variation in Spending on Childbirth Among the Commercially Insured [Internet]. healthcostinstitute.org. Health Care Cost Institute; 2020 May. Available at: HCCI_2020_Childbirth
- Sung S, Mahdy H. Cesarean Section [Internet]. National Library of Medicine. StatPearls Publishing; 2023. Available at: https://www.ncbi.nlm.nih.gov/books/NBK546707/
- WHO Statement On Caesarean Section Rates – World Health Organization. World Health Organization. (2015). Available at: WHO statement on caesarean section rates
- Reducing Unnecessary C-Sections In California. California Health Care Foundation. (2022, June 22). Available at: https://www.chcf.org/project/reducing-unnecessary-c-sections/
- Sandall J, Tribe RM, Avery L, Mola G, Visser GH, Homer CS, et al. Short-term and long-term effects of caesarean section on the health of women and children. The Lancet [Internet]. 2018 Oct;392(10155):1349–57. Available at: https://www.thelancet.com/journals/lancet/article/PIIS0140-6736(18)31930-5/fulltext
- Osterman M, Hamilton B, Martin J, Driscoll A, Valenzuela C. Births: Final Data For 2020. National Center For Health Statistics (U.S.); 2021. Available at: https://www.cdc.gov/nchs/data/nvsr/nvsr70/nvsr70-17.pdf
- Zandkarimi E, Moghimbeigi A, Mahjub H. Assessing The Factors Affecting Cesarean Section Selection In Iranian Women Using Multilevel Count Models With Excess Zeros. Iran J Public Health [Internet]. 2021;50(4):816. Available at: https://dx.doi.org/10.18502/ijph.v50i4.6008
- Henke RM, Wier LM, Marder WD, Friedman BS, Wong HS. Geographic variation in cesarean delivery in the United States by payer. BMC Pregnancy and Childbirth [Internet]. 2014 Nov 19;14(1). Available at: BMC Pregnancy and Childbirth
- Gibbons, L., Althabe, F., Merialdi, M., Betrán, A. P., Lauer, J. A., & Belizán, J. M. (N.D.). The Global Numbers And Costs Of Additionally Needed And Unnecessary Caesarean Sections Performed Per Year: Overuse As A Barrier To Universal Coverage. World Health Organization. 2021. Available at: The Global Numbers and Costs of Additionally Needed and Unnecessary Caesarean Sections Performed per Year
- Betran Ap, Ye J, Moller A-B, Souza Jp, Zhang J. Trends And Projections Of Caesarean Section Rates: Global And Regional Estimates. Bmj Glob Health [Internet]. 2021;6(6):E005671. Available at: Trends and projections of caesarean section rates: global and regional estimates
- Hamilton E. B, Martin A. J, Osterman J.K. M. Births: Provisional Data For 2021. National Center For Health Statistics (U.S.); 2022. Available at: https://www.cdc.gov/nchs/data/vsrr/vsrr020.pdf
- Osterman M, Hamilton B, Martin J. Births: Final Data For 2024. National Center For Health Statistics (U.S.); 2025. Available at: Vital Statistics Rapid Release, Number 038 April 2025
- Specifications Manual for Joint Commission National Quality Measures. The Joint Commission. Perinatal Care (PC): PC-02. Version 2024A1. Available at: PC-02 (v2024A1)